Occupational defined benefit scheme funding analysis 2024
This is an official statistics publication produced by The Pensions Regulator (TPR). This annual publication provides an overview of funding levels and recovery plans in occupational defined benefit (DB) and hybrid pension schemes in the UK. Additional data for calculations and a complete glossary of terms are available in the annex of the report.
Published: 24 September 2024
On this page
- Introduction
- Important changes since last year
- Key findings
- Funding levels
- Recovery plans
- Using this publication
- Glossary
- Contact
Introduction
This publication is based on tranche 17 schemes, with effective valuation dates from 22 September 2021 to and inclusive of 21 September 2022. As the effective dates for the bulk of these valuations are late 2021 and early 2022, the results may not have been impacted by the interest rate rises and volatility in investment markets that occurred over the second half of 2022.
Schemes typically submit funding data to us every three years. This means tranche 17 belongs in the same cohort of schemes as tranches 14, 11, 8, 5 and 2.
By July 2024, we received 1,640 valuations with an effective valuation date covered by tranche 17; 71% of these schemes had submitted valuations in all previous funding cycles.
Important changes since last year
The scope of this bulletin has been changed in order to improve value to our users by focusing on the key figures. This is part of our ongoing improvements to our official statistics reports. Detailed information on funding strategies, discount rates and mortality assumptions can be found in the annex.
The 2024 publication does not include statistics relating to either the PPF stressed/unstressed asset ratio and return seeking asset proportion. We have removed the PPF stressed/unstressed asset ratio (and any tables broken down by this ratio), as these were considered of limited use given that no corresponding stress was applied to the liabilities. We have removed the return seeking assets statistics (and any tables broken down by this), as a result of the recent improvements made to asset reporting in the scheme return. We are undertaking a review of the methodology to account for the more detailed data on asset allocations which will impact how it will return to the publication in 2025.
Key findings
- 47% of schemes reported a surplus position in tranche 17. This compares with 32% in tranche 14.
- The average ratio of assets to technical provisions (TPs) for schemes in tranche 17 was 97% (median: 99%).
- The average recovery plan length for schemes in deficit was 4.7 years (median: 3.9 years), with a median end date falling in 2026. For comparison, the average recovery plan length in tranche 14 was 6.2 years (median: 5.2 years).
Funding levels
Overall, 47% of schemes reported a surplus on the TP funding basis in tranche 17, compared to 32% in tranche 14.
The average funding level was 97% in tranche 17 (median: 99%), compared to 92% in tranche 14 (median: 93%), representing a 5 percentage point increase between funding cycles.
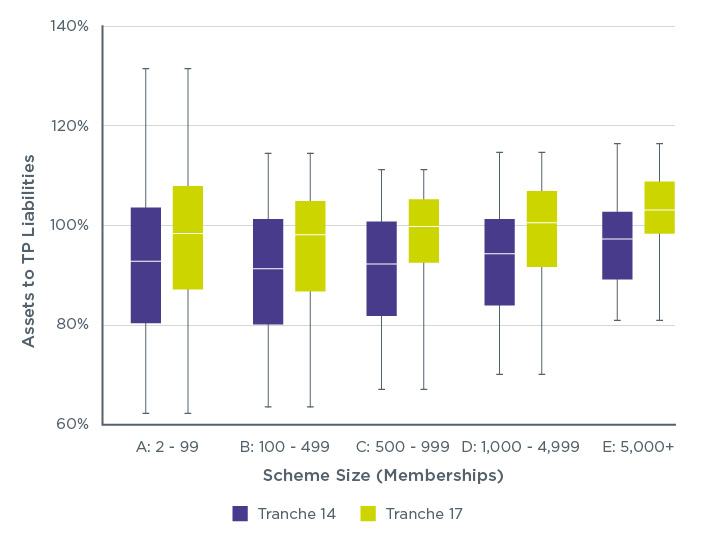
Funding levels have improved in the current tranche compared to tranche 14 across all scheme size categories (Figure 1). The largest median asset to TP funding ratios are seen in the largest schemes (as measured by memberships).
Figure 1: Assets to TP liabilities (%) by scheme membership size (tranche 14 and tranche 17, all schemes)
Distributions are constrained at the 5th and 95th percentiles
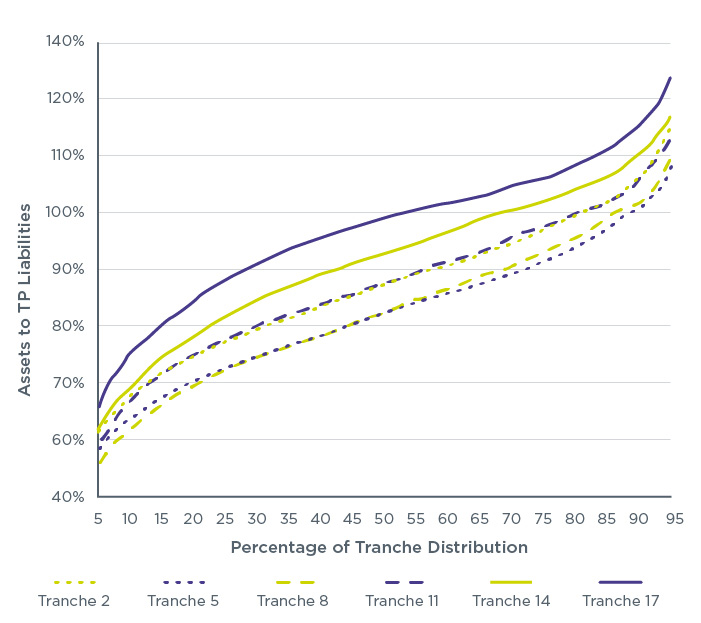
The funding ratio in this cohort of schemes has continually improved since tranche 5, which had a valuation period between 22 September 2009 and 21 September 2010 (Figure 2; annex Table 2.1a).
Figure 2: Ratio of assets TP liabilities (%) (all schemes, all relevant tranches)
Distributions are trimmed at the 5th and 95th percentiles
Recovery plans
Schemes that have a funding shortfall at the effective date of their actuarial valuation are required to prepare a recovery plan to achieve full funding in relation to TPs. In tranche 17, 53% of schemes were required to submit a recovery plan, compared to 67% in tranche 14.
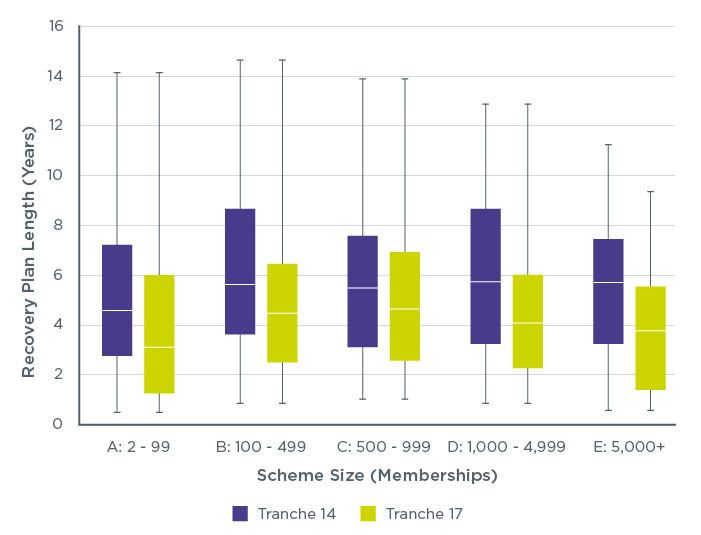
The average recovery plan length in tranche 17 was 4.7 years (median: 3.9 years). The equivalent recovery plan length in tranche 14 was 6.2 years (median: 5.2 years). The reduction in average recovery plan length from tranche 14 to tranche 17 was 1.5 years (median: 1.3 years). The equivalent reduction in average recovery plan length from tranche 11 to tranche 14 was 1.7 years (median: 2.1 years).
Recovery plan lengths were shorter in the current tranche compared to the previous tranche in all membership categories (Figure 3).
Figure 3: Distribution of recovery plan length by scheme membership size and tranche (tranche 17 and tranche 14 schemes in deficit)
Distributions are constrained at the 5th and 95th percentiles
Within the subset of schemes in deficit in both tranches, 83% reported reductions in their recovery plan length between tranche 14 and tranche 17 (Figure 4).
Considering the three-year inter-valuation period, a reduction in recovery plan length of more than three years between tranches means bringing forward the date at which the scheme is anticipated to be fully funded. Between tranche 14 and tranche 17, 46% of schemes (that were in deficit at both valuations) met this reduction.
Figure 4: Changes to recovery plan length between tranche 14 and 17 (representing 730 schemes which were in deficit in both tranches)
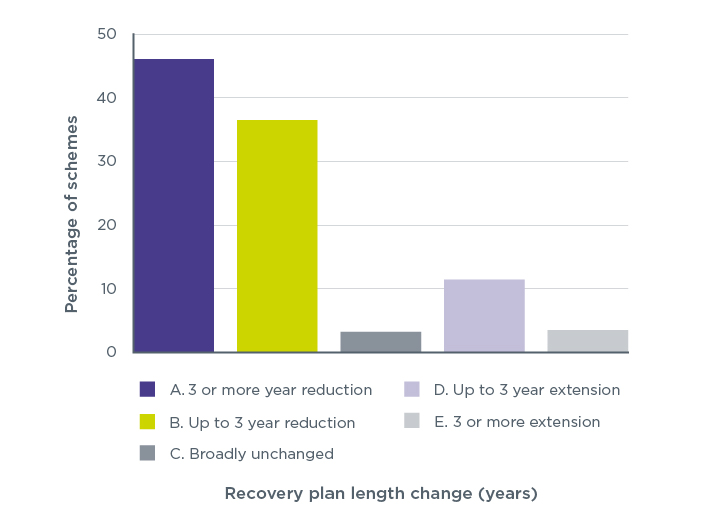
Figure 4: Changes to recovery plan length between tranches (schemes in deficit only in both tranches). 'Broadly unchanged' refers to schemes with a recovery plan length change of less than 0.1 years.
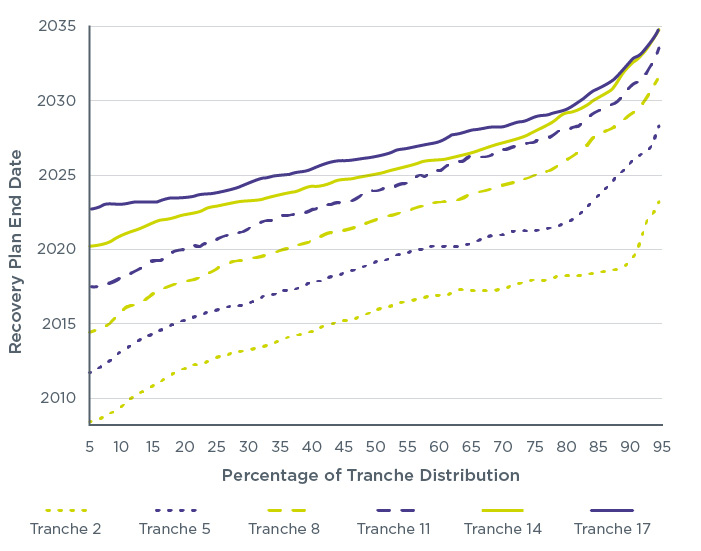
In tranche 17, the median recovery plan end date is anticipated to fall in 2026. In tranche 14, the median recovery plan end date was anticipated to fall in 2025. Note that 320 schemes which were required to submit a recovery plan in tranche 14 were no longer required to do so under tranche 14. Under the first valuations for this cohort of schemes (tranche 2), the median recovery plan end date was estimated to fall in 2016 (Figure 5).
Figure 5: Distribution of recovery plan end dates (schemes in deficit, all tranches)
Distributions are trimmed at the 5th and 95th percentiles
Using this publication
Data sources
The underlying data used in this publication is sourced from valuations and recovery plans. These were submitted to us for schemes with deficit positions, and from annual scheme returns for schemes with surplus positions. The data presented in this report is exactly what was submitted by the scheme, and not rolled forward to a common date.
Assets, liabilities and deficits/surpluses in this bulletin are defined on a TP basis. Where a scheme is sectionalised or segregated each section is treated as if it were a separate scheme for this report.
These valuations are covered by the sixth triennial cycle of scheme funding, with due dates for receipt set for December 2022 to December 2023. None of the valuations in this publication are subject to the new funding and investment strategy requirements which only apply to valuations with an effective date of 22 September 2024 or after.
Considering the three-year valuation cycle, schemes typically submitting valuations in tranche 17 would have submitted their previous valuation in tranche 14. This means in most cases, tranche 14 data is the most appropriate comparison to the latest tranche.
The latest figures on DB scheme membership along with rolled forward asset and liability positions can be found in our occupational DB landscape publication.
Methodology
These statistics report on administrative data. Accuracy is addressed by removing data errors as far as possible. Potential sources of error include:
- schemes entering data incorrectly as part of their scheme return
- mistakes in the programming code used to analyse the data and produce the statistics, and by analysts interpreting the data incorrectly
Throughout this publication we have rounded percentage figures to zero decimal places and recovery plan lengths to one decimal place. Numbers of schemes have been rounded to the nearest 10.