This is an official statistics publication produced by The Pensions Regulator (TPR). This annual publication provides an overview of the occupational DC trust-based landscape in the UK, reporting on memberships and assets. Additional data for analytical purposes can be found in the annex of the report.
Published: May 2024
Introduction
Within this publication we will refer to three different classifications of defined contribution (DC) trust scheme landscape.
- DC schemes: Non-hybrid DC schemes including master trusts (schemes with 12 or more members).
- Micro schemes: Non-hybrid micro DC schemes (schemes with 2 to 11 members). This includes relevant small schemes (RSS) and executive pension plan (EPP) schemes.
- Hybrid schemes: DC sections of hybrid dual-section schemes (schemes with a DC section and a defined benefit (DB) section) including master trusts.
Table 1 below represents the occupational trust-based pension provision in the UK. This data refers to micro and non-micro schemes.
| Defined benefit | Hybrid: mixed benefit* | Hybrid: dual-section | DC (trust) | |
|---|---|---|---|---|
| Schemes | 4,680 | 230 | 560 | 25,800 |
| Total membership | 5,803,750 | 1,481,630 | 4,018,400 | 27,152,730 |
| Total active members | 359,340 | 274,900 | 828,650 | 10,377,290 |
* = also known as true hybrid
Source: all figures from TPR’s data based on scheme returns, 31 December 2023
Important changes since last year
For the 2023 release of this publication, enhancements have been made to our data validation methodology. This will impact data on scheme status, the number of EPP schemes and the number of schemes used for automatic enrolment (AE). Therefore, statistics for these measures should not be compared to previous publications of the DC Trust report. For more details about the validation methodology, please see the methodology section of this report.
Correction notice
We would like to bring to your attention a correction that has been made to the membership levels reported in the 2022 Occupational DC landscape publication. This correction was due to inaccuracies in reported membership levels by a master trust scheme, which were inadvertently included in the 2022 publication. The 2022 publication reported 9,967,000 active members in master trusts (table 10), the correct value is 9,604,000. Other membership figures were impacted similarly. The identification of this issue occurred during our routine time series analysis conducted for the 2023 publication. The necessary corrections have been made and are reflected in the 2023 publication currently. It's important to note that these corrections do not affect the overarching trends in DC membership growth.
Key findings
- The DC landscape has been subject to concentration at a similar rate to previous years. The number of non-micro DC and hybrid schemes decreased by 11% over the last year while the number of members increased by 9%. The reduction in schemes is solely driven by schemes with fewer than 5,000 memberships.
- Master trusts continue to provide for the majority of DC members. 84% of DC or hybrid scheme memberships are within a master trust.
- There has been little growth (1%) in assets per member in 2023. This is down from an annual growth of 10 to 20% in assets per member in the previous three years. Investment markets were volatile in 2022, impacting scheme returns received in 2023 and resulting in a wide dispersion of returns dependent on the date of scheme submissions. The data in this publication includes valuations from as early as December 2022.
Schemes and membership
Schemes
- The total number of open schemes is 7,580, including DC schemes, DC sections of dual section hybrid schemes, and micro schemes.
- Since 2012, the number of non-micro schemes and hybrid schemes has declined by 70% (from 3,660 to 1,080).
- In 2023, the DC landscape has been subject to further concentration. The total number of non-micro schemes, including hybrid schemes, has declined by 11%.
- For DC non-micro schemes, 25% of schemes are open; 98% of memberships are in open schemes; and 96% of assets are in open schemes.
- Of the 25,210 micro schemes, 81% (20,530) identified themselves as an RSS. 3% (830) have been identified as an EPP.
Figure 1: Occupational DC schemes by membership size group (including hybrid schemes, excluding micro schemes) (2012 to 2024)

Table 2: Data underlying Figure 1, pertaining to occupational DC schemes by membership size group (including hybrid schemes) (2012 to 2024)
Number of schemes by Membership Size Group (N)
| Date | 12 to 99 | 100 to 999 | 1,000 to 4,999 | 5,000+ | Total |
|---|---|---|---|---|---|
| 01/01/2012 | 2,260 | 1,030 | 310 | 80 | 3,660 |
| 01/01/2013 | 1,890 | 980 | 300 | 70 | 3,240 |
| 01/01/2014 | 1,780 | 920 | 290 | 80 | 3,080 |
| 01/01/2015 | 1,670 | 870 | 290 | 100 | 2,930 |
| 01/01/2016 | 1,540 | 790 | 290 | 120 | 2,740 |
| 01/01/2017 | 1,340 | 710 | 290 | 130 | 2,470 |
| 01/01/2018 | 1,130 | 630 | 280 | 140 | 2,180 |
| 01/01/2019 | 1,000 | 560 | 270 | 140 | 1,980 |
| 01/01/2020 | 840 | 500 | 250 | 150 | 1,740 |
| 01/01/2021 | 760 | 420 | 240 | 140 | 1,560 |
| 01/01/2022 | 660 | 360 | 210 | 140 | 1,370 |
| 01/01/2023 | 590 | 320 | 180 | 130 | 1,220 |
| 01/01/2024 | 510 | 280 | 160 | 130 | 1,080 |
Source(s): TPR: DC Trust: Presentation of scheme return data 2023 to 2024
Table 3: Occupational DC scheme breakdown table
Table 3 provides a segmentation based on sub-categories where our regulatory intervention varies. For example, master trusts are subject to more regulation than other kinds of DC and hybrid schemes, while RSS and EPP schemes have various exemptions from the statutory requirements.
| DC trust (excluding Master trust) | Master trust | |
|---|---|---|
| Hybrid scheme | 530 | 21 |
| Non-Hybrid scheme | 4,410 | 31 |
| RSS or EPP | 21,370 | 0 |
| Total | 26,310 | 53 |
Note: Scheme numbers are rounded to the nearest 10 for non-master trust, and the figures for master trust are unrounded.
Table 4: number of schemes, memberships and assets by status (excluding micro schemes)
| Open to new joiners and future service | Closed to new joiners, open to future service | Closed to new joiners and future service | Winding Up | Total | |
|---|---|---|---|---|---|
| Number of DC schemes | 150 | 190 | 200 | 60 | 600 |
| Number of DC memberships | 26,635,000 | 243,000 | 70,000 | 133,000 | 27,081,000 |
| DC aggregate assets | £152,326,000,000 | £4,341,000,000 | £672,000,000 | £973,000,000 | £158,312,000,000 |
| Number of hybrid schemes | 210 | 150 | 110 | 10 | 480 |
| Number of hybrid memberships | 1,334,000 | 316,000 | 43,000 | 2,000 | 1,695,000 |
Figure 2: Micro schemes by RSS status (excluding hybrid schemes) (2016 to 2024)
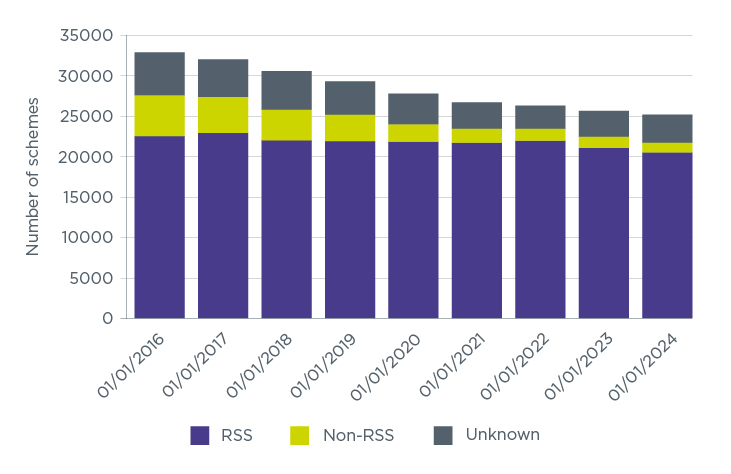
Table 5: Data underlying Figure 2, pertaining to micro schemes by RSS status (excluding hybrid schemes) (2016 to 2024)
Number of schemes by RSS Status (N)
| Date | RSS | Non-RSS | Unknown | Total |
|---|---|---|---|---|
| 01/01/2016 | 22,500 | 5,050 | 5,330 | 32,880 |
| 01/01/2017 | 22,930 | 4,360 | 4,710 | 32,000 |
| 01/01/2018 | 22,070 | 3,670 | 4,790 | 30,530 |
| 01/01/2019 | 21,930 | 3,200 | 4,220 | 29,340 |
| 01/01/2020 | 21,860 | 2,050 | 3,860 | 27,760 |
| 01/01/2021 | 21,750 | 1,670 | 3,300 | 26,720 |
| 01/01/2022 | 21,970 | 1,520 | 2,770 | 26,260 |
| 01/01/2023 | 21,100 | 1,340 | 3,260 | 25,700 |
| 01/01/2024 | 20,530 | 1,220 | 3,450 | 25,210 |
Source(s): TPR: DC Trust: Presentation of scheme return data 2023 to 2024
Memberships
The following figures all relate to non-micro schemes and hybrid schemes.
- Scheme membership has grown by more than 12 times since the beginning of 2012 from 2.3 million to 28.8 million.
- In 2023, scheme memberships have increased by 11%, compared to 11% in 2022.
- There are 35 authorised master trusts, accounting for 26.1 million DC memberships, including hybrid schemes, and over £122.9 billion in assets, excluding hybrid schemes. Master trusts account for over 90% of non-micro memberships and 78% of assets.
Figure 3: Memberships of occupational DC schemes by membership size group (including hybrid schemes, excluding micro schemes) (2012 to 2024)
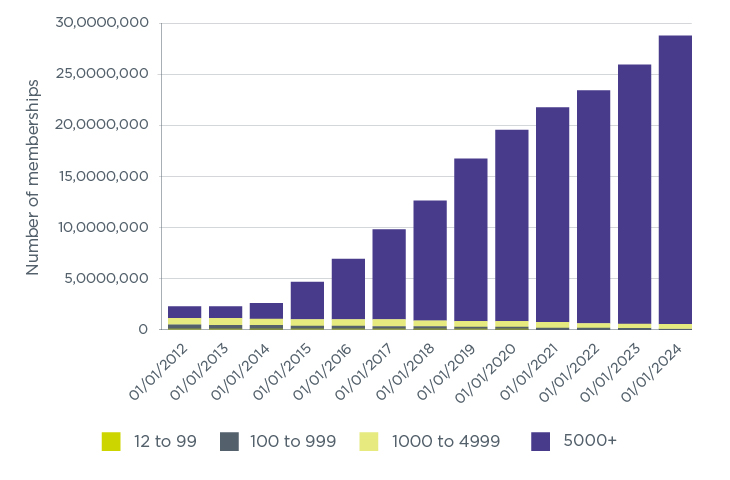
Table 6: Data underlying Figure 3, pertaining to memberships of occupational DC schemes by membership size group (including hybrid schemes) (2012 to 2024)
Number of memberships by Membership Size Group (N)
| Date | 12 to 99 | 100 to 999 | 1,000 to 4,999 | 5,000+ | Total |
|---|---|---|---|---|---|
| 01/01/2012 | 78,000 | 358,000 | 660,000 | 1,159,000 | 2,255,000 |
| 01/01/2013 | 65,000 | 342,000 | 663,000 | 1,196,000 | 2,265,000 |
| 01/01/2014 | 62,000 | 324,000 | 661,000 | 1,566,000 | 2,613,000 |
| 01/01/2015 | 60,000 | 307,000 | 635,000 | 3,666,000 | 4,668,000 |
| 01/01/2016 | 55,000 | 286,000 | 658,000 | 5,932,000 | 6,931,000 |
| 01/01/2017 | 48,000 | 260,000 | 646,000 | 8,866,000 | 9,820,000 |
| 01/01/2018 | 40,000 | 227,000 | 612,000 | 11,743,000 | 12,622,000 |
| 01/01/2019 | 36,000 | 205,000 | 594,000 | 15,934,000 | 16,768,000 |
| 01/01/2020 | 31,000 | 183,000 | 569,000 | 18,833,000 | 19,615,000 |
| 01/01/2021 | 28,000 | 158,000 | 542,000 | 20,994,000 | 21,722,000 |
| 01/01/2022 | 25,000 | 138,000 | 482,000 | 22,767,000 | 23,412,000 |
| 01/01/2023 | 22,000 | 122,000 | 413,000 | 25,449,000 | 26,006,000 |
| 01/01/2024 | 19,000 | 107,000 | 372,000 | 28,278,000 | 28,776,000 |
Source(s): TPR: DC Trust: Presentation of scheme return data 2023 to 2024
Membership in non-micro schemes increased by 9% over the past year (compared to 13% last year), and have grown by more than 11 times since the beginning of 2012.
Table 7: Master trusts table
This table provides figures for all master trust schemes with DC members, including hybrid master trusts.
| Authorised master trusts | |
|---|---|
| Total trusts | 35 |
| Active DC memberships | 9,908,000 |
| Reported assets (excluding hybrids) (£) | 122,860,000,000 |
| DC memberships in schemes which reported assets (excluding hybrids) | 25,886,000 |
| Total DC members | 26,068,000 |
Source(s): All figures from TPR’s data based on scheme returns, 31 December 2023
Financial information
All figures below refer to DC schemes with 12 or more members and exclude hybrid schemes.
- Reported asset values are £158.3 billion in 2023, an increase of £15.3 billion or 11% since last year, and have grown by more than six times since the beginning of 2012.
- There has been little growth (0%) in assets per member in 2023. This is down from an annual growth of 10 to 20% in assets per member in the previous three years. Investment markets were volatile in 2022 impacting scheme returns received in 2023 and resulting in a wide dispersion of returns dependent on the date of scheme submissions. The data in this publication includes valuations from as early as December 2022.
Figure 4: Aggregate reported assets in occupational DC schemes by membership size group (excluding hybrid schemes and micro schemes) (2012 to 2024)
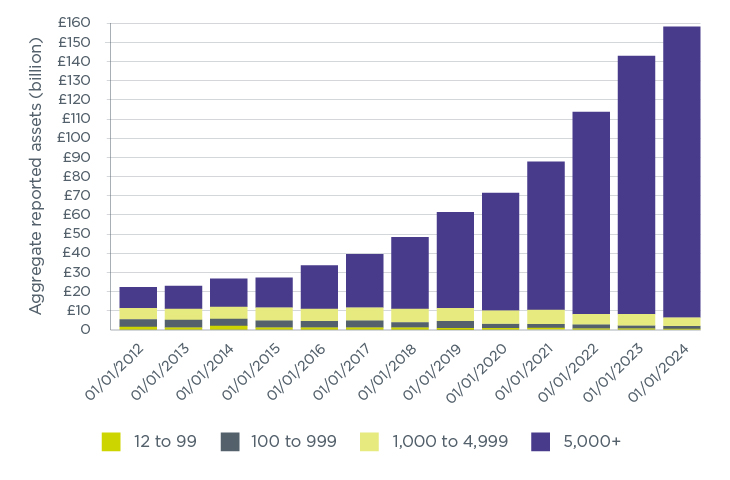
Table 8: Data underlying Figure 4, pertaining to aggregate reported assets in occupational DC schemes by membership size group (excluding hybrid schemes) (2012 to 2024)
Aggregate Assets by Membership Size Group (£)
| Date | 12 to 99 | 100 to 999 | 1,000 to 4,999 | 5,000+ | Total |
|---|---|---|---|---|---|
| 01/01/2012 | £1,122,000,000 | £4,108,000,000 | £5,872,000,000 | £11,040,000,000 | £22,142,000,000 |
| 01/01/2013 | £1,020,000,000 | £3,821,000,000 | £5,904,000,000 | £12,087,000,000 | £22,831,000,000 |
| 01/01/2014 | £1,759,000,000 | £3,808,000,000 | £6,092,000,000 | £14,812,000,000 | £26,470,000,000 |
| 01/01/2015 | £879,000,000 | £3,776,000,000 | £6,684,000,000 | £15,687,000,000 | £27,025,000,000 |
| 01/01/2016 | £883,000,000 | £3,436,000,000 | £6,398,000,000 | £22,902,000,000 | £33,619,000,000 |
| 01/01/2017 | £884,000,000 | £3,742,000,000 | £6,728,000,000 | £28,095,000,000 | £39,449,000,000 |
| 01/01/2018 | £780,000,000 | £2,985,000,000 | £7,099,000,000 | £37,266,000,000 | £48,130,000,000 |
| 01/01/2019 | £668,000,000 | £3,559,000,000 | £6,953,000,000 | £50,116,000,000 | £61,297,000,000 |
| 01/01/2020 | £559,000,000 | £2,433,000,000 | £6,948,000,000 | £61,312,000,000 | £71,252,000,000 |
| 01/01/2021 | £493,000,000 | £2,310,000,000 | £7,272,000,000 | £77,382,000,000 | £87,458,000,000 |
| 01/01/2022 | £417,000,000 | £1,893,000,000 | £5,788,000,000 | £105,449,000,000 | £113,548,000,000 |
| 01/01/2023 | £336,000,000 | £1,952,000,000 | £5,752,000,000 | £134,985,000,000 | £143,025,000,000 |
| 01/01/2024 | £277,000,000 | £1,556,000,000 | £4,413,000,000 | £152,066,000,000 | £158,313,000,000 |
Aggregate asset values are now £158.3 billion, an increase of £15.3 billion or 11% since last year and grown by more than six times since the beginning of 2012.
Source(s): TPR: DC Trust: Presentation of scheme return data 2023 to 2024
Figure 5: Average assets per membership in occupational DC schemes (excluding hybrid schemes and micro schemes) (2012 to 2024)
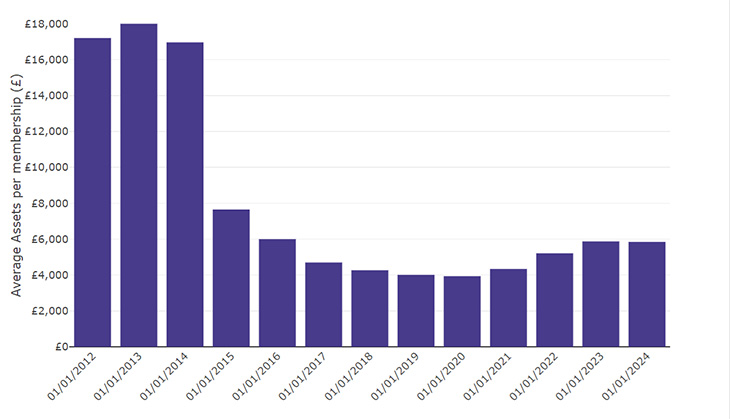
Table 9: Data underlying Figure 5, pertaining to average assets per membership in occupational DC schemes (excluding hybrid schemes) (2012 to 2024)
| Date | Average assets per membership (£) |
|---|---|
| 01/01/2012 | £17,206 |
| 01/01/2013 | £18,008 |
| 01/01/2014 | £16,963 |
| 01/01/2015 | £7,651 |
| 01/01/2016 | £6,002 |
| 01/01/2017 | £4,698 |
| 01/01/2018 | £4,268 |
| 01/01/2019 | £4,009 |
| 01/01/2020 | £3,938 |
| 01/01/2021 | £4,339 |
| 01/01/2022 | £5,212 |
| 01/01/2023 | £5,873 |
| 01/01/2024 | £5,846 |
Average assets per membership have increased by 1% over the past year, but overall have fallen by 66% since the beginning of 2012.
Source(s): TPR: DC Trust: Presentation of scheme return data 2023 to 2024
Automatic enrolment (AE)
All figures below refer to micro and non-micro schemes, excluding hybrid schemes.
- In 2023, the number of schemes that have been used for AE has remained the same. In 2023, 340 schemes were used for AE purposes, a 42% increase on the 240 used for AE in 2016.
- 99% of memberships are in schemes that have been used for AE: 27.0 million out of 27.2 million.
Figure 6: Occupational DC schemes which have been used for automatic enrolment by membership size group (excluding hybrid schemes, including micro schemes) (2016 to 2024)

Table 10: Data underlying Figure 6, pertaining to occupational DC schemes (including micro schemes) being used for automatic enrolment by membership size group (excluding hybrid schemes) (2016 to 2024)
Number of schemes by Membership Size Group (N)
| Date | 2 to 11 | 12 to 99 | 100 to 999 | 1,000 to 4,999 | 5,000+ | Total |
|---|---|---|---|---|---|---|
| 01/01/2016 | 10 | 10 | 90 | 70 | 50 | 240 |
| 01/01/2017 | 20 | 10 | 110 | 80 | 60 | 280 |
| 01/01/2018 | 90 | 20 | 100 | 80 | 70 | 360 |
| 01/01/2019 | 130 | 30 | 90 | 70 | 80 | 400 |
| 01/01/2020 | 160 | 30 | 70 | 60 | 80 | 400 |
| 01/01/2021 | 180 | 30 | 60 | 60 | 70 | 390 |
| 01/01/2022 | 180 | 30 | 50 | 40 | 70 | 360 |
| 01/01/2023 | 180 | 20 | 40 | 40 | 60 | 340 |
| 01/01/2024 | 180 | 20 | 40 | 30 | 60 | 340 |
Source(s): TPR: AE compliance data
Figure 7: Memberships within occupational DC schemes which have been used for automatic enrolment by membership size group (excluding hybrid schemes, including micro schemes) (2016 to 2024)
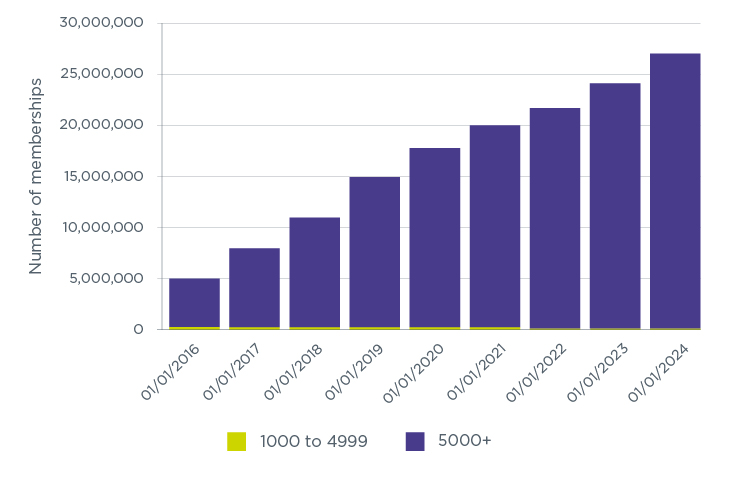
Table 11: Data underlying Figure 7, pertaining to occupational DC scheme memberships (including micro schemes) being used for automatic enrolment by membership size group (excluding hybrid schemes) (2016 to 2024)
Number of memberships by Membership Size Group (N)
| Date | 2 to 11 | 12 to 99 | 100 to 999 | 1,000 to 4,999 | 5,000+ | Total |
|---|---|---|---|---|---|---|
| 01/01/2016 | 0 | 0 | 44,000 | 184,000 | 4,763,000 | 4,992,000 |
| 01/01/2017 | 0 | 1,000 | 48,000 | 191,000 | 7,722,000 | 7,962,000 |
| 01/01/2018 | 0 | 1,000 | 45,000 | 188,000 | 10,701,000 | 10,936,000 |
| 01/01/2019 | 0 | 2,000 | 42,000 | 165,000 | 14,709,000 | 14,918,000 |
| 01/01/2020 | 0 | 1,000 | 32,000 | 164,000 | 17,580,000 | 17,778,000 |
| 01/01/2021 | 0 | 1,000 | 27,000 | 146,000 | 19,757,000 | 19,932,000 |
| 01/01/2022 | 0 | 1,000 | 23,000 | 117,000 | 21,504,000 | 21,646,000 |
| 01/01/2023 | 1,000 | 1,000 | 20,000 | 94,000 | 24,115,000 | 24,231,000 |
| 01/01/2024 | 1,000 | 1,000 | 18,000 | 77,000 | 26,861,000 | 26,957,000 |
Source(s): TPR: DC Trust: Presentation of scheme return data 2023 to 2024 (Table 4.4, and from previous DC Trust publications)
Data sources
The data used to produce our official statistics is collected from all registerable occupational DC and hybrid schemes, through our DC and hybrid scheme returns. This report uses data held by us as of 31 December 2023. DC schemes are required to submit their scheme returns between September and December 2023. Non-micro schemes submit annually and micro schemes submit every three years. Hybrid schemes are required to submit their returns by 31 March annually.
The figures in this report relate to the scheme’s effective date, which for DC schemes falls between 1 September 2022to 31 December 2023. For hybrid schemes it falls between 1 April 2021 and 31 March 2022.
Where a scheme is sectionalised or segregated each section will be treated as if it were a separate scheme for this report. Master trusts are reported as both the number of schemes and the number of authorised master trusts those schemes fall into.
Please note that individuals may have multiple pension entitlements spread over multiple schemes, so they may be included more than once in ‘membership’ counts.
While the vast majority of relevant schemes have provided us with the market value of their scheme assets and annual contributions, it is not completed by every scheme. We limit reporting to those asset or contribution values whose effective date is no more than three years before 31 of December each year, or five years for micro scheme contributions.
We do not report on assets held in DC sections of hybrid schemes or micro schemes as their reporting requirements in the scheme return are different from those for non-micro schemes. Therefore, these results are not comparable to findings in the Office for National Statistics (ONS) Funded Occupational Pension Schemes statistical bulletin, which includes micro schemes and hybrid schemes.
Data on which schemes have been used for AE is sourced from employers’ declarations of compliance. This declaration is a legal duty for employers (or an entity working on their behalf) to submit every three years. All declarations or re-declarations of compliance up to 31 December 2023 have been used.
Methodology
These statistics report on administrative data, and accuracy is addressed by eliminating data errors as far as possible. Potential sources of error include:
- schemes entering data incorrectly as part of their scheme return
- mistakes in the programming code used to analyse the data and produce the statistics, and by analysts interpreting the data incorrectly
Throughout this publication we have rounded scheme numbers to the nearest 10; memberships to the nearest 1,000; financial figures to the nearest million; and percentage figures to 0 decimal places. For this reason, the sum of figures may not equate to the total values.
Total schemes year-on-year
To create the time series of total schemes year-on-year, we start with the total number of DC schemes, with two or more memberships, on the register as at 31 December 2023. We then remove schemes who registered in 2023 and add schemes which wound up in 2023. This creates an estimate for the number of schemes as at 31 December 2022. This process is repeated to 2012.
Year-on-year figures may vary very slightly across publications, as late submissions are received and data coverage is enhanced between publication dates.
RSS and EPP schemes
Within this report, RSS and EPP schemes are always included in the data where micro schemes are included unless stated otherwise.
RSS schemes are identified via schemes declaring their RSS status in the scheme return.
EPP schemes are classified as schemes which have not identified as RSS schemes via the scheme return but meet one of the following criteria:
- they have declared to be an EPP scheme via the DC scheme return
- they have not declared their EPP scheme via the scheme return but the name of the scheme indicates EPP scheme status (eg ‘company XYZ Executive Pension Plan’)
There are 25,210 micro schemes:
- 81% (20,530) are RSS
- 3% (830) are EPP of which 380 were identified through step 2 of the EPP methodology described above
- the remaining micro schemes either declared not to be RSS or EPP schemes or did not declare their status for either RSS or EPP scheme, further breakdown is available in the annex
Scheme status data validation
For hybrid schemes, we are identifying whether the DC part of the hybrid scheme is open.
There are three ordered validation steps applied to DC and hybrid scheme statuses.
- Step 1: where a scheme states they are open but have no active DC members and no employer contributions and no employee contributions, the status is adjusted to 'closed to future service'.
- Step 2: where a scheme states they are closed to new members but have no active DC members and no employer contributions and no employee contributions, the status is adjusted to 'closed to future service'.
- Step 3: where a scheme states they are open but have had declining total membership over the previous three scheme returns, the status is adjusted to 'closed to new members'.
In all other cases, statuses are taken to be as submitted by the scheme.
Contributions data is only considered as part of this validation if it meets all the following criteria:
- the data has been submitted as part of this scheme return
- the value of contributions has changed since the previous scheme return submission
- the value of contributions is larger than £1
For schemes which are classified as closed to future service, any memberships which are classified as 'active' have been reclassified as 'deferred'.
Automatic enrolment
The scheme name received as part of the declaration of compliance is matched to our scheme returns dataset. Where a match by name is made, we consider the scheme to have been used for AE.
These statistics report on administrative data, and accuracy is addressed by eliminating data errors as far as possible.
Potential sources of error include:
- employers entering data incorrectly as part of their declaration or re-declaration of compliance
- matching activities incorrectly filtering out occupational DC pension schemes
Amounts leaving schemes
Memberships (and their assets) leaving a scheme are primarily caused by:
- members retiring and taking benefits
- membership transferring to another scheme
There may be other reasons (eg short service refund, deceased…).
As with assets and contributions, not all schemes have supplied the amounts leaving schemes. In the data sections, we show information for the reported amounts leaving schemes, and the number of members in schemes that have reported their leaver amounts.
Transfers into schemes
Data on assets leaving schemes, members leaving schemes and assets transferred into schemes, has not been provided by all schemes. Data shown is as reported and has not been imputed for missing values.
Transfer data is only included in annex tables.
Asset changes
Asset changes are made up of contributions (including transfers in) and investment returns. They are reduced by charges, retirements and transfers out.
Methodology enhancements in 2023
We have enhanced our methodology for validating scheme status for occupational DC schemes in 2023 as part of a programme of continuous improvement around digital and data. This is to mitigate administrative error and improve the accuracy of the statistics reported in our publication.
For the 2024 report, we have added the scheme status data validation method detailed above.
For AE scheme identification, the data source has changed from scheme return to employer declaration of compliance. This was implemented after a review of the two data sources identified the declaration of compliance data being a better representation of AE, particularly as it forms part of the legal duties for employers. This impacts the data in the AE section of the report, and all time series data has been calculated using the declaration of compliance method for consistency.
For EPP schemes, schemes identified via scheme name matching have been included in all EPP figures, whereas previously they were only included in the methodological notes. This impacts the data in table 3.
Contributions data for micro schemes has been removed from the annex.
Since the 2023 report:
- The number of open DC schemes and DC sections of dual section hybrid schemes has decreased from 23,010 to 7,580. 99% of this decrease has been caused by the additional data validation of scheme status. This has primarily impacted micro schemes, and therefore the impact on memberships and assets in open schemes is much smaller.
- The number of schemes identified as having been used for AE has decreased from 520 to 340. Without the methodological changes we would expect it to rise to 600.
- The AE methodology change has primarily impacted smaller schemes, and the number of memberships in schemes that are used for AE has only had a minor impact: increasing from 98% to 99%.
- The number of schemes identified as EPP has risen from 480 to 830. Without the methodological changes we would expect it to fall to 440.
Contact
If you have a specific enquiry about our occupational DC schemes 2023 official statistics, please contact: TPRSurveys@tpr.gov.uk
Glossary
Bundled/unbundled scheme
A bundled scheme is one where most services are purchased through a single corporate entity, and an unbundled scheme is one where services are provided through different corporate entities.
Contract-based schemes
DC work-based personal pension schemes, also known as contract-based schemes, are excluded from this release. These types of schemes or products consist of:
- Group personal pensions (GPPs)
- Group self-invested personal pensions (GSIPPs)
- Group stakeholder pensions (GSHPs)
DC contract-based schemes are regulated differently from DC trust-based occupational schemes. We work with the Financial Conduct Authority (FCA) in the regulation of contract-based schemes. Contract based schemes provide less information than trust-based schemes as they do not need to provide us with the same information as a trust-based scheme is required to provide. As a result, all types of DC contract-based provision, both group and individual, are outside the scope of this statistics release.
Decumulation options
A scheme offering a lifetime annuity purchases an annuity in the name of the trustees at the point of retirement, and then facilitates payment of that annuity to the member. A scheme offering self-annuitisation will calculate an annuity payment for the member and make the payment to the member directly from scheme funds. If the member uses the fund they have built up to purchase an annuity in their own name then they cease to be a member of the scheme. Pensions drawdown (or income drawdown) is another decumulation option in which the pension is kept invested and the member is able to withdraw an income directly from their pot.
You can find information about decumulation options in section 1: schemes and section 2: memberships.
Dependants
In DC schemes that operate self-annuitisation or lifetime annuities, a member may have the option to purchase a joint life annuity. In this case, a nominated dependant will receive a proportion of the member’s retirement income for the rest of their life, should the member die before the dependant. Membership figures collected reflect those members who are relevant for calculation of the pension levy. As dependants are not included in this,they are not reported to us and so are not included in the statistics in this release.
Executive pension plan (EPP)
An EPP is a scheme:
- in relation to which a company is the only employer and the sole trustee
- the members of which are either current or former directors of the company and include at least one third of the current directors
Hybrid schemes
DC trust focuses on schemes in the ‘DC (trust)’ category, as well as any DC memberships of ‘hybrid: dual-section’ schemes. We do not include data on assets held in DC sections of hybrid schemes, as they include DC additional voluntary contributions (AVCs) and are therefore not comparable to the DC assets figures.
There are many varieties of hybrid schemes, but they can broadly be classed as either mixed benefit or dual-section:
- a mixed benefit scheme offers one set of benefits, which has elements of both defined benefit (DB) and DC schemes; such as a DC scheme with an underpin on a DB basis
- a dual-section scheme has two sections - one offering DC benefits and the other offering DB benefits
Master trusts
A master trust is defined as an occupational pension scheme that:
- provides money purchase benefits (whether alone or in conjunction with other benefits)
- is used, or intended to be used, by two or more employers
- is not used, or intended to be used, only by employers that are connected with each other
- is not a relevant public service pension scheme
A master trust may also be a group of schemes, none of which are already master trusts, which provide money purchase benefits, and where each scheme in the group is under ‘common control’ with other schemes in the group. We refer to this group of schemes as ‘cluster schemes’ in our master trust code of practice.
Member status
Active
- In relation to an occupational pension scheme, means a person who is in pensionable service under the scheme.
- Funds continue to be invested.
- Funds continue to attract charges.
Deferred
- In relation to an occupational pension scheme, means a person (other than an active or pensioner member) who has accrued rights under the scheme.
- Funds continue to be invested.
- Funds continue to attract charges.
Pensioner
- In relation to an occupational pension scheme, means a person who in respect of his pensionable service under the scheme or by reason of transfer credits, is entitled to the present payment of pension or other benefits.
- Funds can remain invested if the scheme operates a decumulation option.
- Funds can continue to attract charges if the scheme operates a decumulation option.
The number of memberships does not equate to the number of individuals, as one individual can have multiple memberships.
Relevant small schemes (RSS) – formerly known as small self-administered schemes (SSAS)
An RSS is a scheme where:
- the scheme has fewer than 12 members
- all members are appointed as trustees to the scheme or all members are directors of the company, which is the sole trustee of the scheme
- the scheme’s rules provide that any decisions to be made by the trustee(s) are made by unanimous agreement of (a) the trustees who are members of the scheme or (b) directors of the corporate trustee who are members of the scheme, or the scheme has a trustee/ corporate trustee/director who is independent in relation to the scheme for the purposes of section 23 of the Pensions Act 1995 and is registered on our trustee register
Scheme status
Open to new joiners and future service
- New members are allowed to join the scheme.
- Existing members are (or employers) allowed to continue contributing.
- Funds continue to be invested.
- Funds continue to attract charges.
Closed to new joiners, open to future service
- New members are not allowed to join the scheme.
- Existing members are (or employers) allowed to continue contributing.
- Funds continue to be invested.
- Funds continue to attract charges.
Closed to new joiners and future service
- New members are not allowed to join the scheme.
- Existing members are (or employers) not allowed to continue contributing.
- Funds continue to be invested.
- Funds continue to attract charges.
Winding up
- New members are not allowed to join the scheme.
- Existing members are (or employers) not allowed to continue contributing.
- Funds continue to be invested.
- Funds continue to attract charges.
Pensioner members
The data in this publication does not capture all pensioner members. Some members will have retired but transferred out of the scheme. We do however report the number of members for whom the scheme is providing (self-annuitisation) or facilitating (lifetime annuities) the annuity payments.