Occupational defined contribution landscape in the UK 2024
This is an official statistics publication produced by The Pensions Regulator (TPR). This annual publication provides an overview of the occupational DC trust-based landscape in the UK, reporting on memberships and assets. Additional data for analytical purposes can be found in the annex.
In this publication we include a varied scheme population in our statistics reflecting different data collection for various scheme types. Please take note whether micro schemes and hybrid schemes are included in each statistic.
Published: 4 March 2025
Please note that annex tables which are split by scheme status also contain this error however TPR are not planning to correct these tables because the updated tables will be available in the 2025 publication which is due to be released shortly. 6,000 micro DC schemes are impacted by this issue.
If you have any concerns please contact evidenceandinsight@tpr.gov.uk.
On this page
- Introduction
- Important changes since last year
- Schemes and memberships
- Assets
- Automatic enrolment (AE)
- Data sources
- Methodology
- Glossary
Introduction
Table 1 below represents the occupational trust based pension provision in the UK. This data includes micro schemes.
| Defined benefit | Hybrid: mixed benefit* | Hybrid: dual-section | DC (trust) | |
|---|---|---|---|---|
| Schemes | 4,610 | 280 | 480 | 25,190 |
| Total membership | 5,766,000 | 1,655,000 | 3,691,000 | 28,996,000 |
| Total active members | 339,000 | 296,000 | 748,000 | 10,457,000 |
* = Also known as 'true hybrid'
Important changes since last year
This year we are publishing figures of hybrid and micro scheme assets for the first time. Previously we have only presented assets for non micro DC schemes, but following user engagement we are providing a view of all DC schemes assets. Historic values for hybrid and micro schemes assets are not available. Current values are presented in table 5 of this publication. Please see the methodology section in this publication for details on quality assurance of asset values.
A data correction for scheme assets has been implemented in this publication impacting total scheme assets and assets for schemes over 5,000 members in both 2022 and 2023. As a result total assets have increased by 3% in 2022 and 4% in 2023. The source of the original error was caused by an incorrect submission by a scheme.
Due to improving data management methods, we are currently reviewing data quality linked to registered scheme status in our historic time series data only. For critical analysis we recommend including a 5% error margin when using any time series data. As we review the issue, we will keep our statistical users informed of any updates.
Key findings
- The DC landscape has been subject to concentration at a faster rate to previous years.
- The number of non micro DC and hybrid schemes decreased by 15% over the last year, from 1,080 schemes in 2023 to 920 schemes in 2024, compared to an 11% decrease the previous year. There are now fewer than 1,000 non micro DC schemes.
- The reduction in schemes is primarily made up of schemes with fewer than 5,000 memberships.
- The number of members increased by 6%, from 28.8 million members in 2023 to 30.6 million members in 2024, which is smaller than the 11% increase seen the year before.
- Master trusts continue to provide for the majority of DC members. Master trusts hold 28.0 million memberships (91% of non micro DC and hybrid schemes) and £166 billion in assets (81% of DC schemes assets).
- DC scheme assets, excluding micro and hybrid schemes, have grown by 25%, from £164 billion in 2023 to £205 billion in 2024.
- Growth in assets is driven by a combination of contributions and investment returns.
- There has been a stable growth in assets per member, from £6,000 in 2023 to £7,000 in 2024 (17% increase).
- DC assets in hybrid schemes amount to £62 billion, this accounts for 23% of total DC assets (£267 billion), including hybrid.
Schemes and memberships
Schemes
- Since 2011, the number of non micro schemes and hybrid schemes has declined by 75% (from 3,660 to 920).
- In 2024, the DC landscape has been subject to further concentration. The total number of non micro schemes, including hybrid schemes, has declined by 15%, from 1,080 schemes in 2023 to 920 schemes in 2024. The reduction in schemes is primarily driven by schemes with fewer than 5,000 memberships.
- For DC non micro schemes, 120 schemes are open (24%), 28.4 million memberships are in open schemes (98%), and £198 billion worth of assets are held in open schemes (97%).
- Of the 24,680 micro schemes, 84% (20,720) identified themselves as a relevant small scheme (RSS). 3% (700) have been identified as an executive pension plan (EPP).
Table 2: Number of schemes by master trust RSS and EPP status (including micro schemes and hybrids) (2024)
| DC trust (excluding Master trust) | Master trust | |
|---|---|---|
| Hybrid scheme | 450 | 23 |
| Non-Hybrid scheme | 3,740 | 28 |
| RSS or EPP | 21,430 | 0 |
| Total | 25,620 | 51 |
Note: Scheme numbers are rounded to the nearest 10 for non-master trust, and the figures for master trust are unrounded.
Table 2 provides a segmentation based on sub-categories where our regulatory intervention varies. For example, master trusts are subject to more regulation than other kinds of DC and hybrid schemes, while RSS and EPP schemes have various exemptions from the statutory requirements. There are 33 authorised master trusts. Throughout this publication we treat each of the sections of these master trusts as separate schemes and therefore regard master trusts as having 51 schemes.
Figure 1: Occupational DC schemes by membership size group (including hybrid schemes, excluding micro schemes) (2011 to 2024)
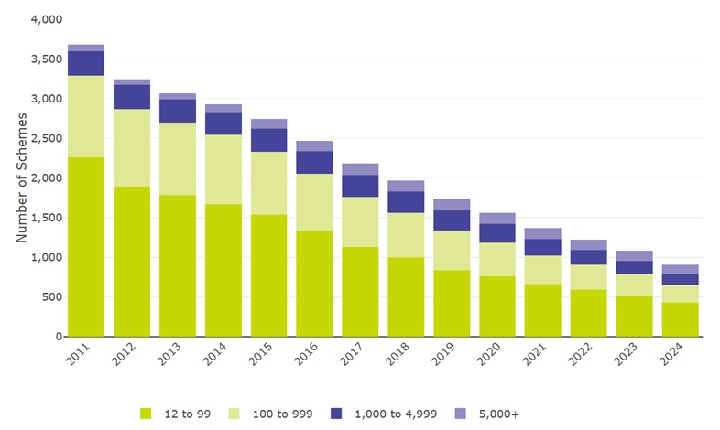
Figure 1 shows the trend in the number of occupational DC schemes by membership size from 2011 to 2024, including hybrid schemes and excluding micro schemes. The data corresponding to this figure is available in the annex 1, table 1.16. The number of schemes in the non micro landscape has changed in the following ways:
- The total number of schemes decreased by 75%, from 3,660 in 2011 to 920 in 2024.
- The steepest decline occurred in schemes with 12 to 99 memberships, from 2,260 in 2011 to 430 schemes in 2024, a decrease of 81%.
- The number of larger schemes with over 5,000 memberships increased from 80 in 2011 to 120 schemes in 2024.
- 51 of these schemes are master trusts.
- Since 2015, the total number of schemes has steadily decreased by an average of 11% per year. Notably, since 2020, the most substantial annual decrease happened in small schemes, with those having 12 to 999 memberships experiencing average yearly declines of 14%.
- Comparing 2024 to 2023, the number of schemes with 12 to 4,999 memberships decreased by 17%. The number of schemes with over 5,000 memberships decreased by 8% from 130 to 120 schemes.
Table 3: Number of schemes, memberships and assets by status (excluding micro schemes) (2024)
| Open to new joiners and future service | Closed to new joiners, open to future service | Closed to new joiners and future service | Winding Up | Total | |
|---|---|---|---|---|---|
| Number of DC schemes | 120 | 150 | 180 | 50 | 510 |
| Number of DC memberships | 28,366,000 | 207,000 | 35,000 | 319,000 | 28,926,000 |
| DC aggregated assets | £197,780,000,000 | £5,717,000,000 | £450,000,000 | £681,000,000 | £204,629,000,000 |
| Number of hybrid schemes | 180 | 140 | 90 | 10 | 410 |
| Number of hybrid memberships | 1,273,000 | 358,000 | 66,000 | 1,000 | 1,699,000 |
Figure 2: Micro schemes by RSS status (excluding hybrid schemes) (2015 to 2024)
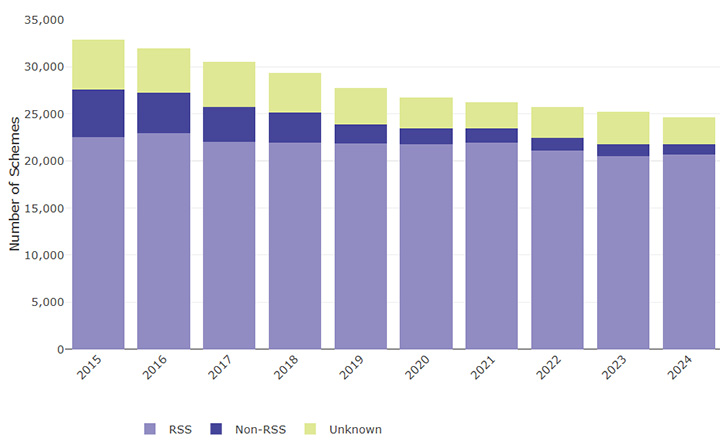
Figure 2 shows the trend in the number of micro schemes, by regulatory scheme status from 2015 to 2024, excluding hybrid schemes. The schemes are divided into three categories: RSS, non-RSS and unknown. The data corresponding to this figure is available in annex 1, table 1.17.
- In 2024 of 24,680 micro schemes, 20,720 are RSS (84%). This compares to 81% in 2023.
- The total number of micro schemes decreased by 25% from 32,880 in 2015 to 24,680 in 2024.
- Non-RSS schemes experienced the highest decrease of 79%, from 5,050 schemes in 2015 to 1,050 in 2024, with the sharpest decline registered in 2019.
- RSS schemes remained the largest category throughout the period, with the lowest decrease of 8% from 22,500 schemes in 2015 to 20,720 in 2024.
Memberships
The following figures all relate to non micro schemes and hybrid schemes:
- Scheme memberships are now more than 13 times larger than the number of memberships in 2011, with 30.6 million memberships in 2024 compared to 2.3 million in 2011.
- Scheme memberships have increased by 6% between 2023 and 2024, compared to 11% between 2022 and 2023.
- Master trusts account for 28.0 million (91%) DC memberships, including hybrid schemes.
Figure 3: Memberships of occupational DC schemes by membership size group (including hybrid schemes, excluding micro schemes) (2011 to 2024)
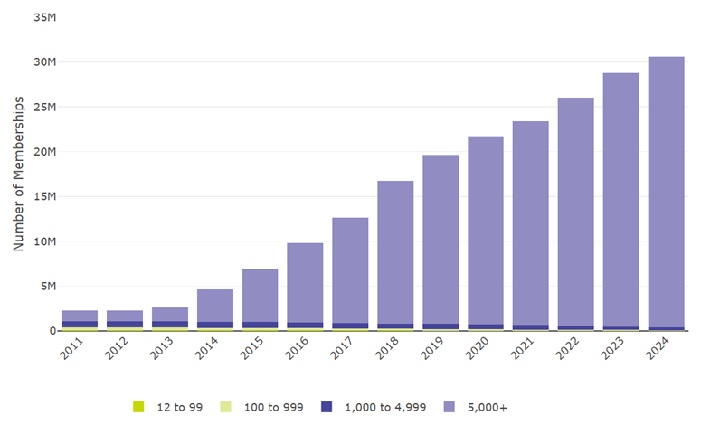
Figure 3 shows the trend in the number of memberships of occupational DC schemes by membership size group from 2011 to December 2024, including hybrid schemes and excluding micro schemes. Scheme memberships are now more than 13 times larger than the number of memberships in 2011, with 30.6 million memberships in 2024 compared to 2.3 million in 2011. Automatic enrolment (AE) was launched in a staggered approach from October 2012 until February 2018; this led to a large increase in the number of memberships. The data corresponding to this figure is available in annex 2, table 2.1.
- Most of the growth happened in schemes with over 5,000 memberships, from 1.2 million memberships in 2011 to 30.2 million in 2024.
- The steepest growth occurred in 2014 where schemes with over 5,000 memberships went from 1.6 million memberships in 2013 to 3.7 million, an increase of 134%.
- Smaller schemes with 12 to 4,999 memberships saw a steady decline, from 1.1 million memberships in 2011 to 0.4 million in 2024.
- Since 2019, the number of memberships has been growing at a slower rate, with an average annual increase of 11%.
- Comparing 2024 to 2023, memberships increased by 6%. This growth was driven mostly by schemes with over 5,000 memberships, which saw a 7% rise in memberships, while schemes with 12 to 4,999 memberships saw a 13% decrease. Active members remained at 11.1 million, whereas deferred members increased by 10% from 17.7 million to 19.5 million (see tables 2.2 and 2.3 from the annex).
Table 4: Figures for all master trust schemes with DC members, including hybrid master trusts. (2024)
| Authorised master trusts | |
|---|---|
| Total trusts | 33 |
| Active DC memberships | 10,009,000 |
| Reported assets (excluding hybrids) (£) | 165,838,000,000 |
| DC memberships in schemes which reported assets (excluding hybrids) | 27,799,000 |
| Total DC members | 28,005,000 |
Assets
All figures below refer to DC schemes with 12 or more members and exclude hybrid schemes unless explicitly stated otherwise.
- Reported asset values in DC schemes are £205 billion in 2024, an increase of £41 billion or 25% since last year, and are more than nine times larger than in 2011 when assets were £22 billion.
- Reported DC asset values for master trusts are £166 billion in assets. This accounts for 81% of DC asset values.
- Reported DC asset values in hybrid schemes are £62 billion in 2024. DC assets in hybrid schemes account for 23% of DC assets (including hybrid).
- In 2024, there has been a growth of 17% in assets per member. Since 2020, there has been an average annual growth of 13% in assets per member.
Table 5 also provides asset values for schemes with 11 or fewer members (micro schemes).
Table 5: Aggregate reported assets in occupational DC schemes by membership size group and scheme type (including hybrid schemes and micro schemes, excluding RSS and EPP schemes) (2024)
| Scheme type | 2 to 11 | 12 to 99 | 100 to 999 | 1,000 to 4,999 | 5,000+ | Total |
|---|---|---|---|---|---|---|
| DC | £213,000,000 | £269,000,000 | £1,171,000,000 | £3,424,000,000 | £199,765,000,000 | £204,842,000,000 |
| Hybrid | £914,000,000 | £332,000,000 | £4,164,000,000 | £12,462,000,000 | £44,838,000,000 | £62,710,000,000 |
| Total | £1,127,000,000 | £601,000,000 | £5,335,000,000 | £15,885,000,000 | £244,603,000,000 | £267,551,000,000 |
Figure 4: Aggregate reported assets in occupational DC schemes by membership size group (excluding hybrid schemes and micro schemes) (2011 to 2024)
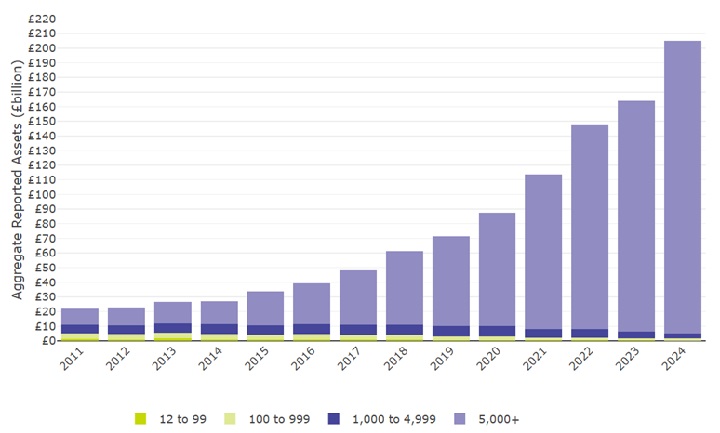
Figure 4 shows the trend in the aggregate reported assets in occupational DC schemes (excluding hybrid schemes and micro schemes), by membership size group from 2011 to 2024. The aggregate assets are more than 9 times larger than the assets in 2011, from £22 billion in 2011 to £205 billion in 2024. The steepest growth of aggregate assets occurred in 2021 and 2022, from £88 billion in 2020 to £114 billion in 2021, an increase of 30%, followed by another increase of 30% to 148 billion in 2022. The data corresponding to this figure is available in annex 3, table 3.1.
- Most of the growth happened to schemes with over 5,000 memberships, with aggregate assets now 18 times larger than they were in 2011. Assets in these schemes have risen from £11 billion in 2011 to £200 billion in 2024. Since 2019, the average yearly growth of total reported assets was 22%. This compares to an average growth in memberships of 11% since 2019.
- Schemes with 12 to 4,999 memberships have seen an overall decrease in their reported assets, from £11 billion in 2011 to £5 billion in 2024. Since 2011, their average annual decline in reported assets has been 5%, with the sharpest average decrease of 12% occurring since 2019. This compares to a 10% average decrease of their memberships since 2019.
- The aggregate assets are more than 9 times larger than the assets in 2011, from £22 billion in 2011 to £205 billion in 2024.
Figure 5: Average assets per membership in occupational DC schemes (excluding hybrid schemes and micro schemes) (2011 to 2024)
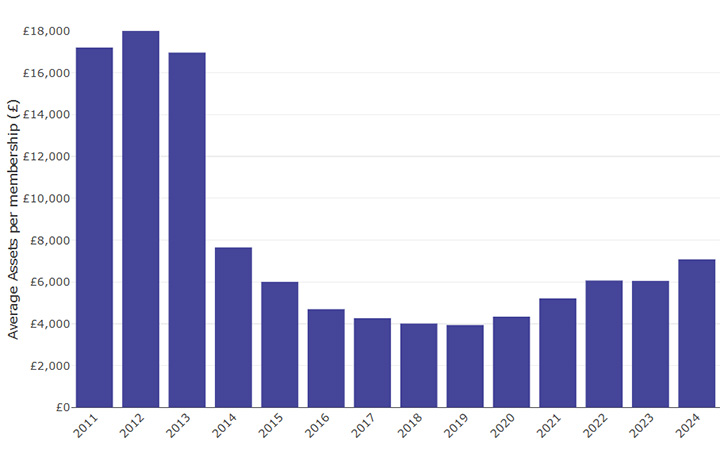
Figure 5 shows the trend in the average assets per membership in occupational DC schemes from 2011 to 2024, excluding hybrid schemes and micro schemes. The data corresponding to this figure is available in annex 3, table 3.48.
- There is a steep decline in average assets per memberships between 2012 and 2014, from £18,000 assets per memberships to £7,700, followed by a gradual decline until 2019, reaching £3,900.
- AE was launched in a staggered approach from October 2012, and the decline of 55% assets per membership in 2014 corresponds to an increase in membership of 126% in the same year.
- From 2020 onward there was a recovery in average assets per membership, rising to £5,200 in 2021 and reaching £7,100 by December 2024.
- Comparing 2024 to 2023, there has been an increase of £1,000 in average assets per membership, from £6,100 in 2023 to £7,100 in 2024.
Automatic enrolment (AE)
All figures below refer to micro and non micro schemes, excluding hybrid schemes.
- In 2024, the number of schemes that have been used for AE has decreased by 6%, from 340 in 2023 to 320 in 2024. There has been a 33% increase in the number of schemes used for AE since 2015.
- 99% of memberships are in schemes that have been used for AE: 28.8 million out of 29.0 million.
Figure 6: Occupational DC schemes which have been used for AE by membership size group (excluding hybrid schemes, including micro schemes) (2015 to 2024)
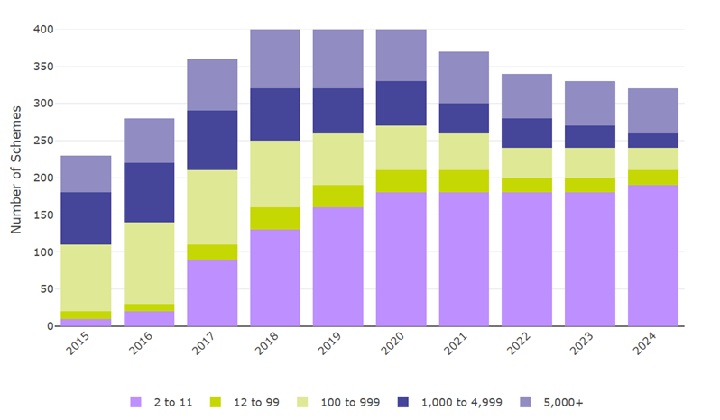
Figure 6 shows the trend in the number of occupational DC schemes used for AE, by membership size group from January 2015 to December 2024, excluding hybrid schemes and including micro schemes. The data corresponding to this figure is available in annex 4, table 4.13.
- In 2015 the number of schemes used for AE was 240. This peaked in 2020 at 390 schemes and had fallen to 320 schemes in 2024.
- The growth in schemes used for AE has predominantly come from micro schemes which increased from 10 in 2015 to 190 in 2024.
Figure 7: Memberships within occupational DC schemes which have been used for AE by membership size group (excluding hybrid schemes, including micro schemes) (2015 to 2024)
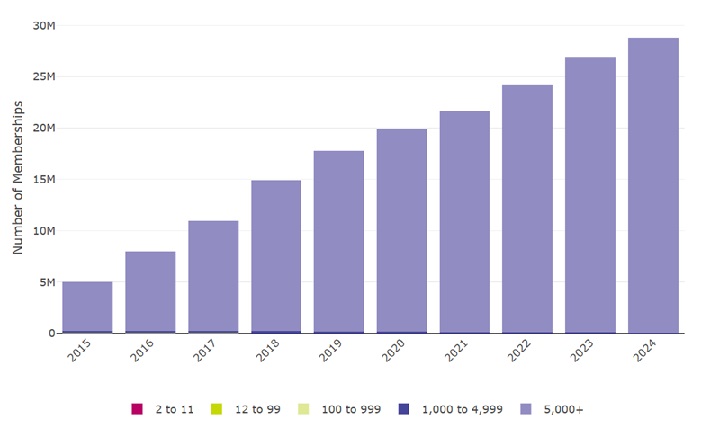
Note: 2 to 999 membership size groups are included in figure 7, but amount to less than 48,000 memberships.
Figure 7 shows the trend in the number of memberships of occupational DC schemes which have been used for AE, by membership size group from 2015 to 2024, excluding hybrid schemes and including micro schemes. The total number of memberships is 6 times larger in 2024 than in 2015 with 29 million memberships compared to 5 million. The data corresponding to this figure is available in the annex 4, table 4.14.
- The total number of memberships in DC schemes used for AE in 2024 accounted for 99% of all memberships in DC schemes.
- This percentage of members in schemes used for AE has grown consistently from 88% in 2015 to 99% in 2024.
- Between 2023 and 2024 the actual number of memberships in schemes used for AE grew from 27.0 million to 29.0 million.
Data sources
The data used to produce our official statistics is collected from all registerable occupational DC and hybrid schemes, through our DC and hybrid scheme returns. This report uses data held by us as of 31 December 2024. DC schemes are required to submit their scheme returns between September and December 2024. Non micro schemes submit annually and micro schemes submit every three years. Hybrid schemes are required to submit their returns by 31 March annually.
The figures in this report relate to the scheme’s effective date, which for DC schemes falls between 1 September 2023 to 31 December 2024. For hybrid schemes it falls between 1 April 2023 and 31 March 2024.
Where a scheme is sectionalised or segregated, each section will be treated as if it were a separate scheme for this report. Master trusts are reported as both the number of schemes and the number of authorised master trusts those schemes fall into.
Please note that individuals may have multiple pension entitlements spread over multiple schemes, so they may be included more than once in ‘membership’ counts.
While the vast majority of relevant schemes have provided us with the market value of their scheme assets and annual contributions, it is not completed by every scheme. We limit reporting to those asset or contribution values whose effective date is no more than three years before 31st of December each year, or five years for micro scheme contributions.
Data on which schemes have been used for AE is sourced from employers’ declarations of compliance. This declaration is a legal duty for employers (or an entity working on their behalf) to submit every three years. All declarations or re-declarations of compliance up to 31 December 2024 have been used.
Methodology
These statistics are derived from administrative data, and accuracy is addressed by eliminating data errors as far as possible. Potential sources of error include the following:
- schemes entering data incorrectly as part of their scheme return
- data processing while creating structured datasets from the scheme return input and any manual corrections as part of that process
- mistakes in the programming code used to analyse the data and produce the statistics, and by analysts interpreting the data incorrectly
Throughout this publication, within data tables we have rounded scheme numbers to the nearest 10, memberships to the nearest 1,000, financial figures to the nearest million, and percentage figures to 0 decimal places. For this reason, the sum of figures may not equate to the total values. Within the text of the publication we have rounded scheme numbers to the nearest 10, memberships to the nearest 0.1 million, financial figures to the nearest billion, and percentage figures to 0 decimal places.
Total schemes year-on-year
To create the time series of total schemes year-on-year, we start with the total number of DC schemes, with two or more memberships, on the register as at 31 December 2024. We then remove schemes who registered in 2024 and add schemes which wound up in 2024. This creates an estimate for the number of schemes as at 31 December 2023. This process is repeated back to 2011.
Year-on-year figures may vary very slightly across publications, as late submissions are received and data coverage is enhanced between publication dates.
RSS and EPP schemes
Within this report, RSS and EPP schemes are always included in the data where micro schemes are included, unless stated otherwise.
RSS schemes are identified via schemes declaring their RSS status in the scheme return.
Schemes may have an unknown RSS status if they have been registered for less than three years, if they have cancelled all previous scheme returns by request or if they have deleted their RSS flag.
EPP schemes are classified as schemes which have not identified as RSS schemes via the scheme return but meet one of the following criteria:
- they have declared to be an EPP scheme via the DC scheme return
- they have not declared their EPP scheme via the scheme return but the name of the scheme indicates EPP scheme status (for example, 'company XYZ Executive Pension Plan')
Scheme status data validation
There are three ordered validation steps applied to the status of DC schemes and DC sections of hybrid schemes.
- Step 1: where a scheme states they are open but have no active DC members and no employer contributions and no employee contributions, the status is adjusted to 'closed to future service'.
- Step 2: where a scheme states they are closed to new members but have no active DC members and no employer contributions and no employee contributions, the status is adjusted to 'closed to future service'.
- Step 3: where a scheme states they are open but have had declining total membership over the previous three scheme returns, the status is adjusted to 'closed to new members'.
In all other cases, statuses are taken to be as submitted by the scheme.
Contributions data is only considered as part of this validation if it meets all the following criteria:
- the data has been submitted as part of this scheme return
- the value of contributions has changed since the previous scheme return submission
- the value of contributions is larger than £1
For schemes that are classified as closed to future service, any memberships that are classified as 'active' have been reclassified as 'deferred'.
Reported hybrid scheme assets
Hybrid scheme assets included in this publication are:
- any DC assets held by DC members of the scheme
- any DC assets held by DB members of the scheme, for example, additional voluntary contributions
Only hybrid schemes with a recent valuation were included:
- for non micro hybrid schemes this is within the last 5 years
- for micro hybrid schemes this was within the last 3 years
As part of our data validation process, data outliers were identified and either confirmed or corrected by the scheme.
Reported micro scheme assets
Only non RSS/EPP micro schemes are in scope for micro scheme asset statistics. We have also removed micro schemes who have not submitted a valuation in the last 5 years, and micro schemes with outlier asset values.
Outlier assets values are defined as schemes which have:
- assets exceeding £1 billion
- assets per members which has increased or decreased by 10 times compared to the most recent submission (typically 3 years previously)
As a result of removing micro schemes who have not submitted a valuation in the last 5 years and outliers, 19% of otherwise in scope schemes are excluded from the statistics.
Automatic enrolment
The scheme name received as part of the declaration of compliance is matched to our scheme returns dataset. Where a match by name is made, we consider the scheme to have been used for AE.
These statistics report on administrative data, and accuracy is addressed by eliminating data errors as far as possible.
Potential sources of error include:
- employers entering data incorrectly as part of their declaration or re-declaration of compliance
- matching activities incorrectly filtering out occupational DC pension schemes
- data processing while creating structured datasets from the declaration of compliance input and any manual corrections as part of that process
Amounts leaving schemes
Memberships (and their assets) leaving a scheme are primarily caused by:
- members retiring and taking benefits
- membership transferring to another scheme
There may be other reasons such as a short service refund or deceased members.
As with assets and contributions, not all schemes have supplied the amounts leaving schemes. In the data sections, we show information for the reported amounts leaving schemes, and the number of members in schemes that have reported their leaver amounts.
Transfers into schemes
Data on assets leaving schemes, members leaving schemes and assets transferred into schemes, has not been provided by all schemes. Data shown is as reported and has not been imputed for missing values.
Transfer data is only included in the annex tables.
Asset changes
Asset changes are made up of contributions (including transfers in) and investment returns. They are reduced by charges, retirements and transfers out.
Contact
If you have a specific enquiry about our occupational DC schemes 2024 official statistics, please contact: evidenceandinsight@tpr.gov.uk
Glossary
Automatic enrolment (AE)
By law, every employer with at least one member of staff has duties, including enrolling those who are eligible into a workplace pension scheme and contributing towards it. This is called automatic enrolment because it is automatic for staff – they don’t have to do anything to be enrolled into a pension scheme, but it is not automatic for employers.
Bundled / unbundled scheme
A bundled scheme is one where most services (e.g. investment and administration) are purchased through a single corporate entity, and an unbundled scheme is one where services are provided through different corporate entities.
Contract-based schemes
DC work-based personal pension schemes, also known as contract-based schemes, are excluded from this release. These types of schemes or products consist of the following:
- group personal pensions (GPPs)
- group self-invested personal pensions (GSIPPs)
- group stakeholder pensions (GSHPs)
DC contract-based schemes are regulated differently from DC trust-based occupational schemes. We work with the Financial Conduct Authority (FCA) in the regulation of contract-based schemes. Contract based schemes provide less information than trust-based schemes as they do not need to provide us with the same information as trust-based schemes. As a result, all types of DC contract-based provision, both group and individual, are outside the scope of this statistics release.
Decumulation options
A scheme offering a lifetime annuity purchases an annuity in the name of the trustees at the point of retirement, and then facilitates payment of that annuity to the member. A scheme offering self-annuitisation will calculate an annuity payment for the member and make the payment to the member directly from scheme funds. If the member uses the fund they have built up to purchase an annuity in their own name then they cease to be a member of the scheme. Pensions drawdown (or income drawdown) is another decumulation option in which the pension is kept invested and the member is able to withdraw an income directly from their pot.
You can find information about decumulation options in Section 1: Schemes and Section 2: Memberships.
Dependants
In DC schemes that operate self-annuitisation or lifetime annuities, a member may have the option to purchase a joint life annuity. In this case, a nominated dependant will receive a proportion of the member’s retirement income for the rest of their life, should the member die before the dependant. Membership figures collected reflect those members who are relevant for calculation of the pension levy. As dependants are not included in this, they are not reported to us and so are not included in the statistics in this release.
Effective date
A scheme’s effective date is the date which the data refers to. Memberships, assets and scheme characteristics all refer to the values on the scheme’s effective date.
Executive pension plan (EPP)
An EPP is a scheme:
- in relation to which a company is the only employer and the sole trustee
- the members of which are either current or former directors of the company and include at least one third of the current directors
Hybrid schemes
DC trust focuses on occupational DC schemes, as well as any DC memberships in hybrid: dual-section schemes.
There are many varieties of hybrid schemes, but they can broadly be classed as either mixed benefit or dual-section:
- a mixed benefit scheme offers one set of benefits, which has elements of both defined benefit (DB) and DC schemes, such as a DC scheme with an underpin on a DB basis
- a dual-section scheme has two sections – one offering DC benefits and the other offering DB benefits
Master trusts
A master trust is defined as an occupational pension scheme that:
- provides money purchase benefits (whether alone or in conjunction with other benefits)
- is used, or intended to be used, by two or more employers
- is not used, or intended to be used, only by employers that are connected with each other
- is not a relevant public service pension scheme
A master trust may also be a group of schemes, none of which are already master trusts, which provide money purchase benefits, and where each scheme in the group is under ‘common control’ with other schemes in the group. We refer to this group of schemes as ‘cluster schemes’ in our master trust code of practice.
Micro schemes
A micro scheme is a scheme with 2 to 11 members.
Member status
| Active | Deferred | Pensioner |
|---|---|---|
| In relation to an occupational pension scheme, means a person who is in pensionable service under the scheme, | In relation to an occupational pension scheme, means a person (other than an active or pensioner member) who has accrued rights under the scheme | In relation to an occupational pension scheme, means a person who in respect of his pensionable service under the scheme or by reason of transfer credits, is entitled to the present payment of pension or other benefits |
| Funds continue to be invested | Funds continue to be invested | Funds can remain invested if the scheme operates a decumulation option |
| Funds continue to attract charges | Funds continue to attract charges | Funds can continue to attract charges if the scheme operates a decumulation option |
The number of memberships does not equate to the number of individuals, as one individual can have multiple memberships.
Relevant small schemes (RSS) – formerly known as small self-administered schemes (SSAS)
An RSS is a scheme where:
- the scheme has fewer than 12 members
- all members are appointed as trustees to the scheme or all members are directors of the company, which is the sole trustee of the scheme
- the scheme’s rules provide that any decisions to be made by the trustee(s) are made by unanimous agreement of (a) the trustees who are members of the scheme or (b) directors of the corporate trustee who are members of the scheme, or the scheme has a trustee/ corporate trustee/ director who is independent in relation to the scheme for the purposes of section 23 of the Pensions Act 1995 and is registered on our trustee register.
Scheme status
| Open to new joiners and future service | Closed to new joiners, open to future service | Closed to new joiners and future service | Winding up |
|---|---|---|---|
| New members are allowed to join the scheme | New members are not allowed to join the scheme | New members are not allowed to join the scheme | New members are not allowed to join the scheme |
| Existing members are (or employers) allowed to continue contributing | Existing members are (or employers) allowed to continue contributing | Existing members are (or employers) not allowed to continue contributing | Existing members are (or employers) not allowed to continue contributing |
| Funds continue to be invested | Funds continue to be invested | Funds continue to be invested | Funds continue to be invested |
| Funds continue to attract charges | Funds continue to attract charges | Funds continue to attract charges | Funds continue to attract charges |
Pensioner members
The data in this publication does not capture all pensioner members. Some members will have retired but transferred out of the scheme. We do however report the number of members for whom the scheme is providing (self-annuitisation) or facilitating (lifetime annuities) annuity payments.